Introduction:
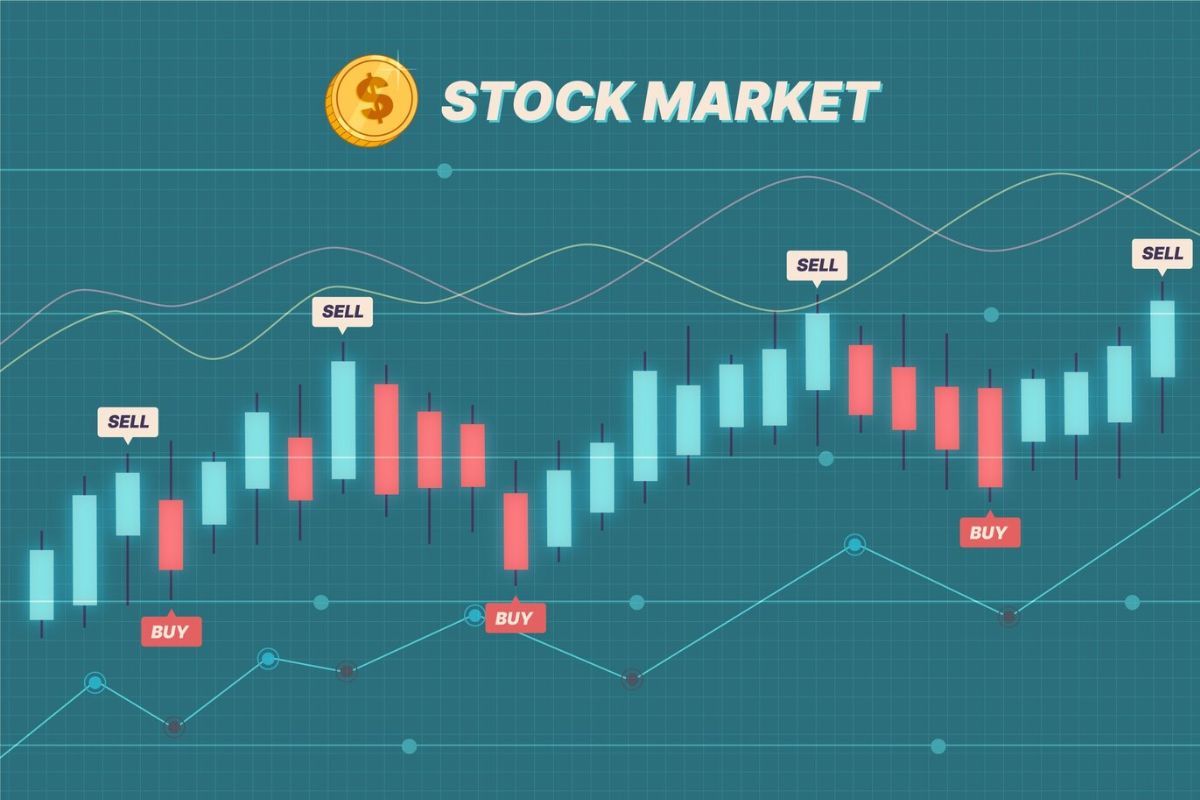
In the dynamic world of intraday trading, mastering technical analysis is crucial for success. Among the various tools available, candlestick chart patterns stand out for their ability to provide insightful signals. In this article, we will explore the best 5 candlestick chart patterns that intraday traders can leverage to make informed decisions and enhance their trading strategies.
1. Head and Shoulders Pattern:
Description: The Head and Shoulders pattern is a powerful reversal pattern that indicates a potential change in the trend. Key Features: Three peaks – a higher peak (head) between two lower peaks (shoulders). Signals a shift from bullish to bearish or vice versa.
YouTube Example Video:
2. Bullish and Bearish Engulfing Patterns:
Description: Engulfing patterns occur when a larger candle completely engulfs the previous candle, signaling a potential reversal. Key Features: Bullish Engulfing – a green candle follows a red one, indicating a bullish reversal. Bearish Engulfing – a red candle follows a green one, signaling a bearish reversal.
YouTube Example Video:
3. Double Top and Double Bottom Patterns:
Description: These patterns highlight potential trend reversals after a price reaches a certain level twice. Key Features: Double Top – two peaks at a similar price level, suggesting a bearish reversal. Double Bottom – two troughs at a similar price level, indicating a bullish reversal.
YouTube Example Video:
4. Doji Candlestick Pattern:
Description: A Doji signifies indecision in the market, often appearing as a small candle with wicks on both ends. Key Features: Indicates a potential reversal or continuation depending on market context. Can be a Doji, Long-Legged Doji, or Dragonfly/Gravestone Doji.
YouTube Example Video:
https://www.youtube.com/embed/px_Zt8fSEa8?si=mK28s7WGcQ2JG2Oe
5. Pennant and Flag Patterns:
Description: These patterns represent short-term consolidation before the resumption of the prevailing trend. Key Features: Pennant – converging trendlines forming a small symmetrical triangle. Flag – rectangular-shaped consolidation after a sharp price movement.
YouTube Example Video:
Conclusion: Intraday traders can gain a competitive edge by understanding and incorporating these powerful candlestick chart patterns into their analysis. However, it’s essential to combine technical analysis with other indicators and risk management strategies for a comprehensive trading approach. By mastering these patterns, traders can make more informed decisions and increase their chances of success in the fast-paced world of intraday trading.